How I Watch What My Coding Agents Are Doing
I’ve been using Command Bridge, the voice tool I built for my agents, daily for a few months now. Being able to talk to just one of them, who manages all the others, has let me grow my fleet and take on more projects. However, another key to scaling this up, at least for personal productivity, is transparency. Seeing in real time what they’re reading, writing, executing, etc., or whether they’re idle.
Watching the terminal
I don’t use Claude Code CLI anymore, nor Codex CLI, although these two harnesses still run everything underneath. I just use Command Bridge. I used to open these CLIs in Windows Terminal, one pane per agent, so I could always see what they were doing. The messages flew by on the screen and I’d catch things like one of them editing something it shouldn’t, writing a new file that didn’t make sense, or running a command unrelated to my ask. That was manageable with three panes and got hard by six.
The tool calls and long walls of text also got harder to follow the longer they ran. I liked a post that showed agent loops literally as loops, some bigger, some smaller. I found that way of visualizing their work interesting, but not useful to me.
Catching a rogue agent
What I needed instead was a more persistent way to trace their actions at a glance. I wanted to see which repos they were working in, which files they were reading and writing, and which commands they were executing.
That lets me catch a rogue agent doing something it shouldn’t. In the clip at the top, one of them reads a .env file and then runs a recursive delete, and I see each one the moment it happens. I have written rules and permissions around this, and seeing it happen gives me yet another layer of control.
The sunflower view
So I built this view for Command Bridge that shows the whole fleet working at once. Each agent is a card on the left, each repo is a box, and each file they touch is a dot inside its repo. Lines connect each card to what it’s reading, writing or running right now, so I can see who’s doing what across all my repos. I wanted this view to be objective, not generated by AI. So, it reads what each session is actually doing from the Claude Code and Codex session logs and git, all locally.
Each agent has a card on the left with its name and current state, like thinking, speaking or idle. I can follow each one by its color, which stays the same on its card, its lines and its pie slices. Each card also has a bar showing how much of the agent’s context window it has used.
Each repo gets a box, and each dot inside is a file that’s been touched. The dots keep their places in the sunflower spiral. Files outside a repo go in a “no repo” box.
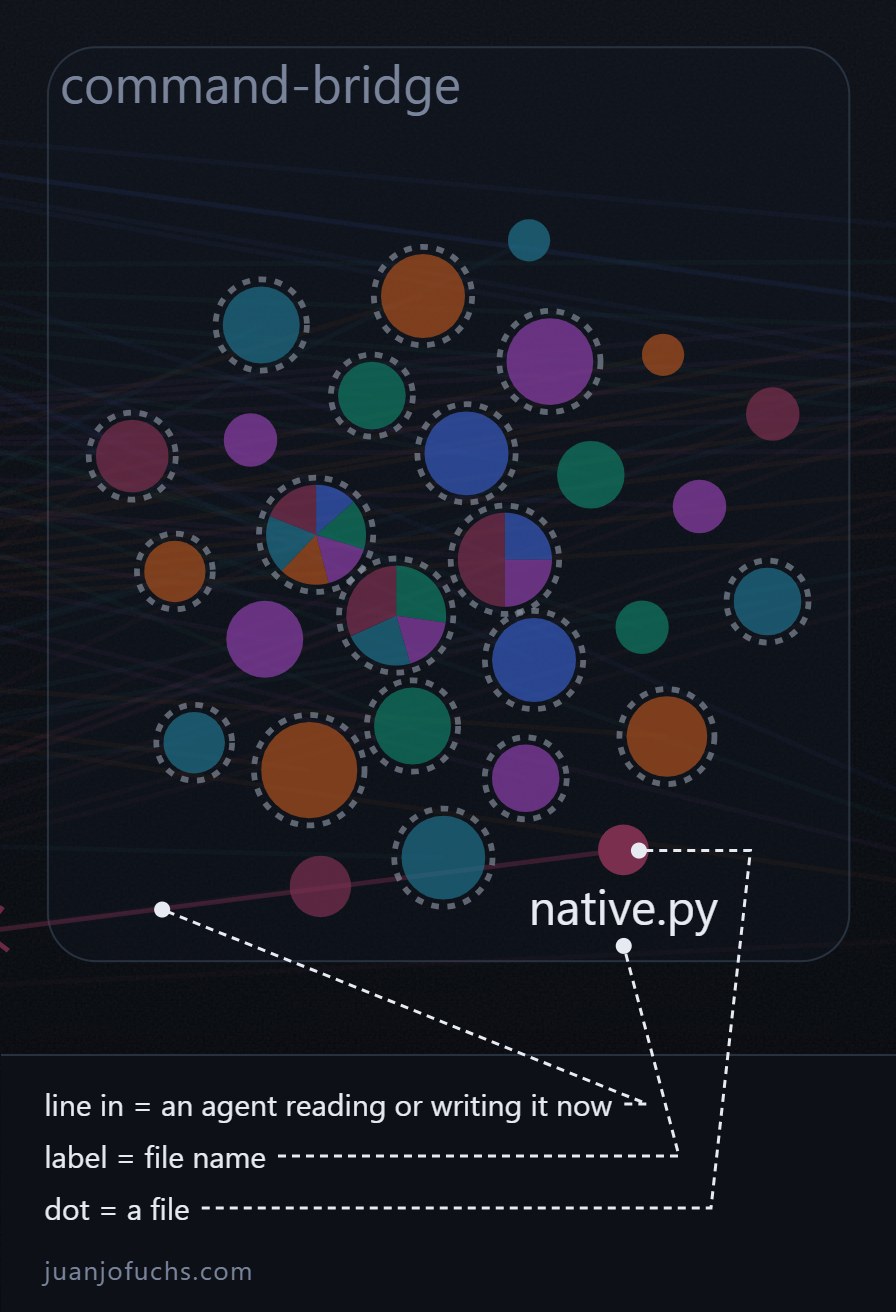
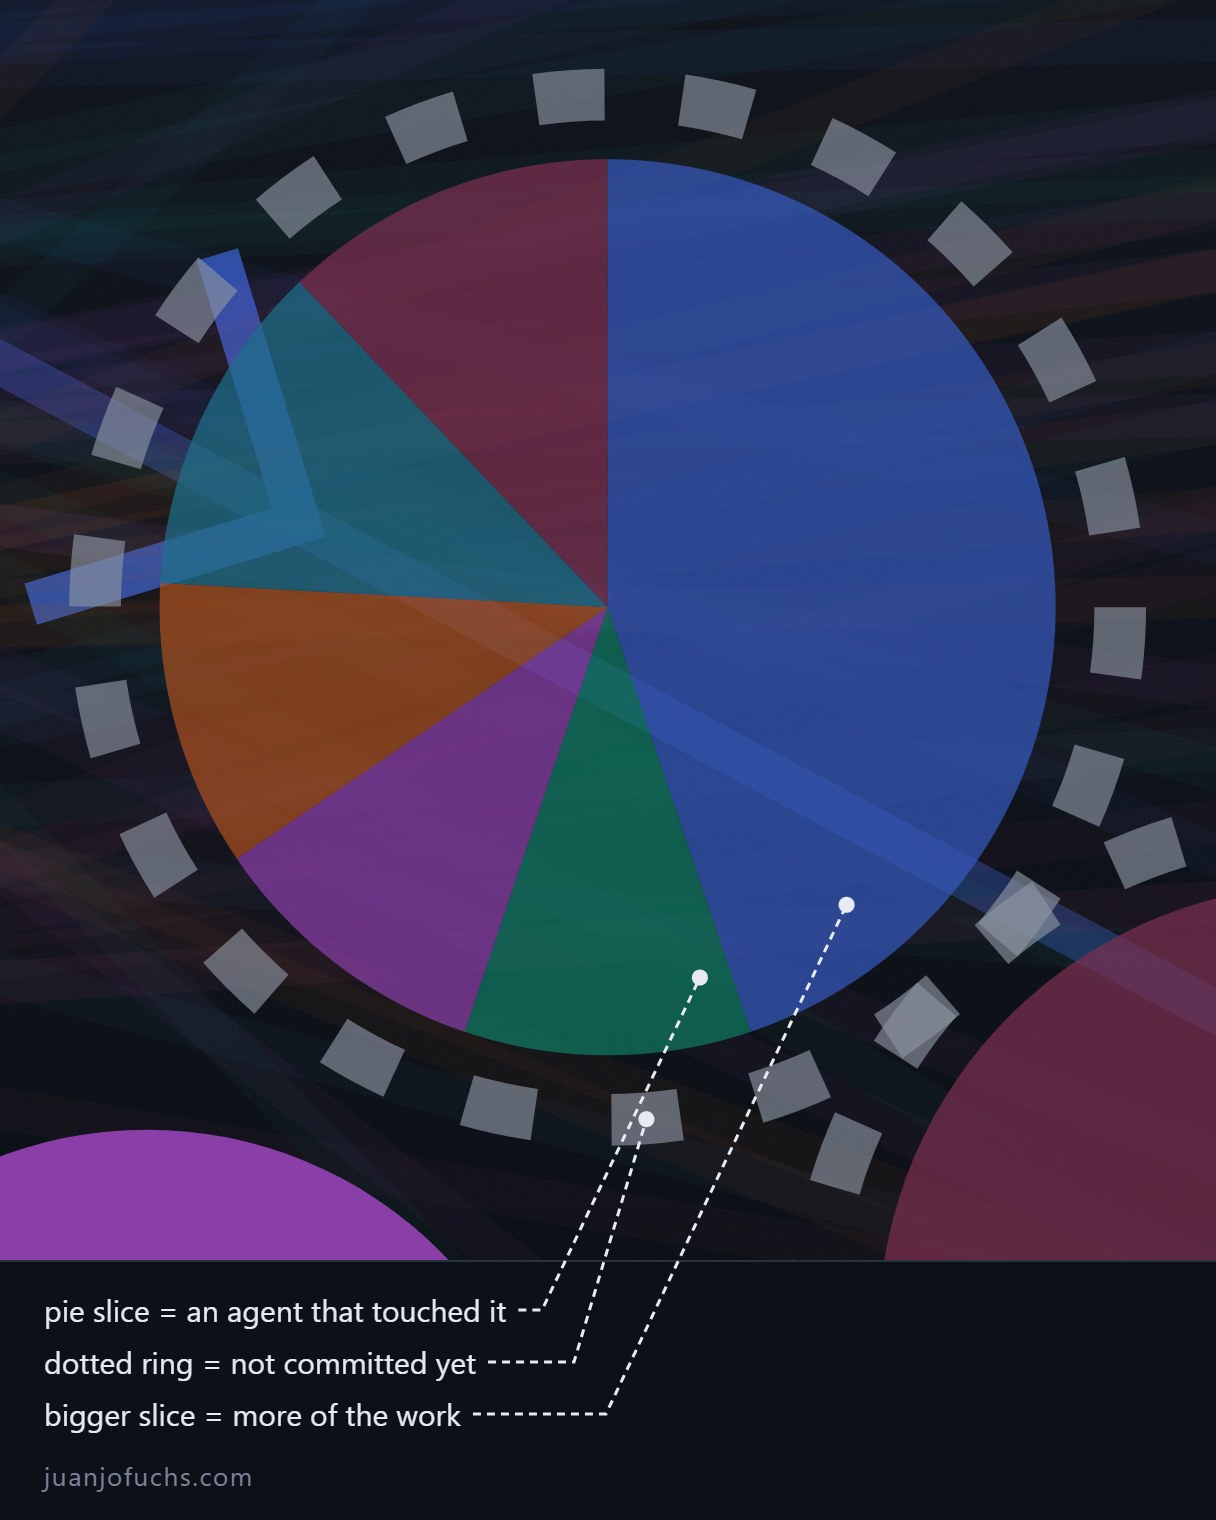
A dot grows with the interactions to that file. Its pie slices show each agent’s share of those touches. I can match the largest slice to an agent’s color to see who touched the file most. A dotted gray ring means the file isn’t committed yet. Dots and their lines dim as activity gets older, and old ones drop off.
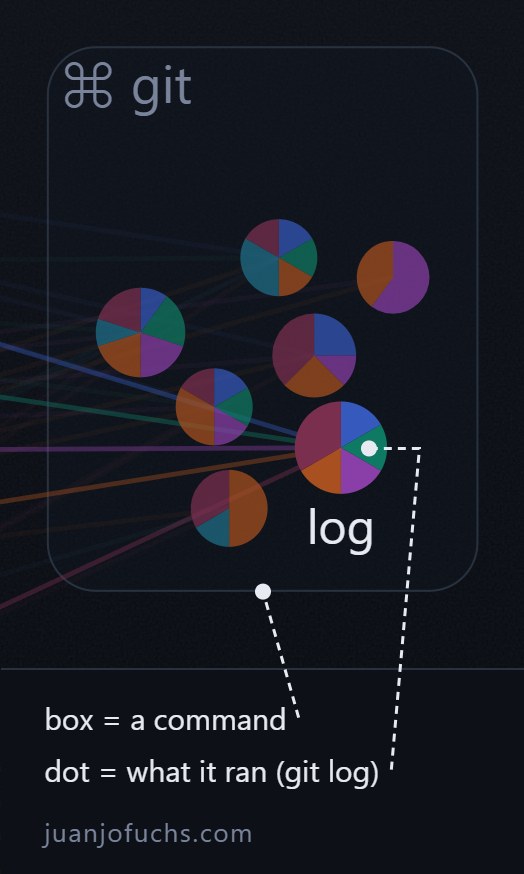
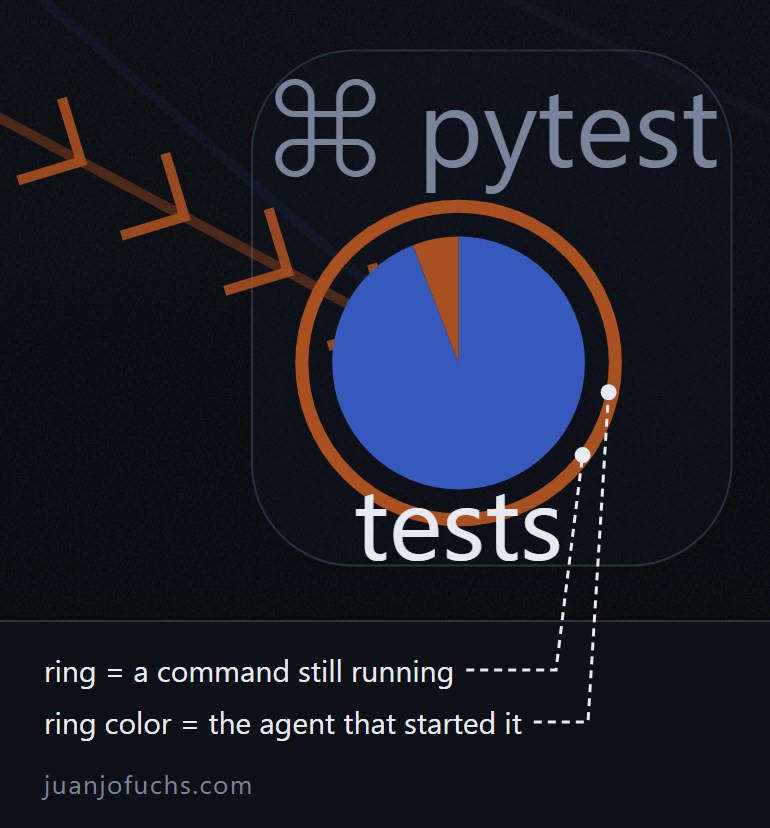
The lines connect each agent to what it’s doing. For 15 seconds after activity, small arrows move toward a file for an edit or write, and back toward the card for a read. More arrows mean more tokens read or written. Each command gets a dot in its tool’s box, so git log is the log dot in the git box. A running command has a slowly pulsing ring in the color of whoever started it.
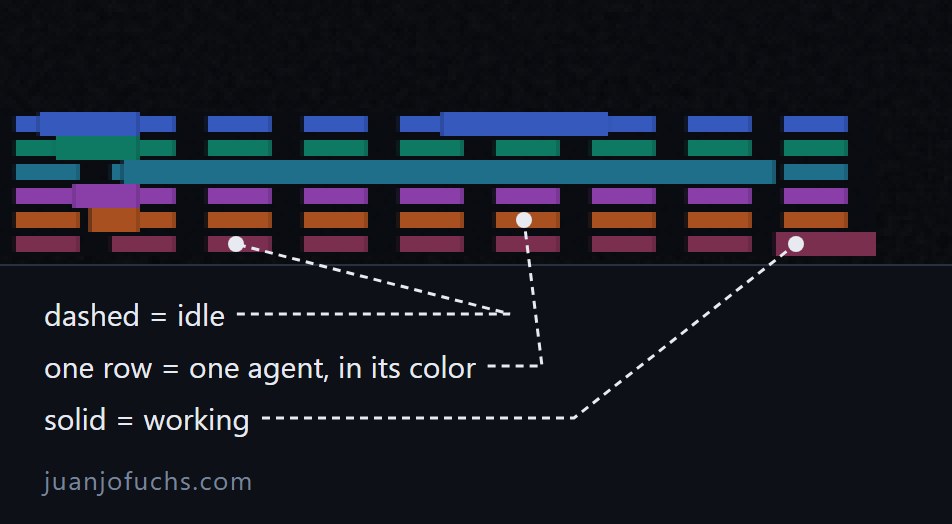
The lines at the bottom are a timeline of each agent, solid while it’s working and dashed while it’s idle.
Organizing the view
I was exploring ways to pack a lot of information into this view and still read it at a glance. At first I was directing the agent on how to place the objects, I wanted the dots in something like a grid, with the newer ones on the outside, like a timeline of what was touched. I was forcing it to place the dots in a particular way and it was struggling to implement it exactly how I wanted it, I guess I failed to describe all the different scenarios for it, so I eventually gave up and asked it for the best way to organize them, and it suggested the sunflower spiral, so the dots never pile up.
The repos went the same way. I asked it to put the repo boxes in a particular way, it struggled, and when I asked for the best way it suggested skyline packing, like Tetris: each new box drops into the lowest open spot, so there are no gaps. The dots sit in a spiral inside each repo, and the boxes pack together.
It looked better than what I was imagining.
What comes next
I’m still exploring the best way to direct many agents at a time and do multiple things in parallel. In order to continue to scale this up, it’s important to be able to understand and see live what all the agents are doing, so I catch issues early and keep the ownership of what they do. The sunflower view is how I do that today.